Mission Endurance and Coverage
How much ground one pack maps with the Survey3W, and where the energy goes. It joins three other analyses: power from Propulsion, drag and trim from Wing Aerodynamics and the CFD behind the C model, and the camera limits from Survey3. This page first describes the first build, Fuselage C v2.4B with our wing and its fences (restated 2026-10-22). The analysis of the earlier wing follows it, kept for its reasoning: the low-battery triggers, the across-the-wind rule and the line order came from it.
The short version: plan on about 255 ha per 6S2P P50B pack on Fuselage C by day, with the lines across the wind, at 21 m/s on the airspeed indicator and 116 m (240 ha in an 8 m/s crosswind, 243 ha at night with the lights). A 100 ha block takes about 20 minutes and 78 Wh on the planning basis, 36 % of the pack. The aircraft is heavier than the earlier wing’s planning mass (3.03 kg against 2.85), and on the side static ports 21 m/s indicated is about 23.4 m/s true, so it covers less than the earlier page’s 288 ha. The forward overlap is about 77 %, not 80 %: no speed and altitude the aircraft is allowed to fly reaches 80 % with the 1.6 s trigger. All figures are estimates until the first real survey log.
The first build: Fuselage C v2.4B
Section titled “The first build: Fuselage C v2.4B”One survey on Fuselage C, phase by phase
Section titled “One survey on Fuselage C, phase by phase”The standard case is the same block as before: a 100 ha square 300 m from the launch point, lines at 116 m. The aircraft is the day build, 3,025 g (CG). It flies the survey at 21 m/s as the flight controller reads it on the side static ports at ARSPD_RATIO 2.3, which is about 23.4 m/s true at the line’s angle of attack. The phases outside the lines are the ones the filed parameters fly: the takeoff to 50 m, the transition to AIRSPEED_MIN 20, the return at RTL_ALTITUDE 80, and a QRTL that brakes, positions and descends from about 65 m.
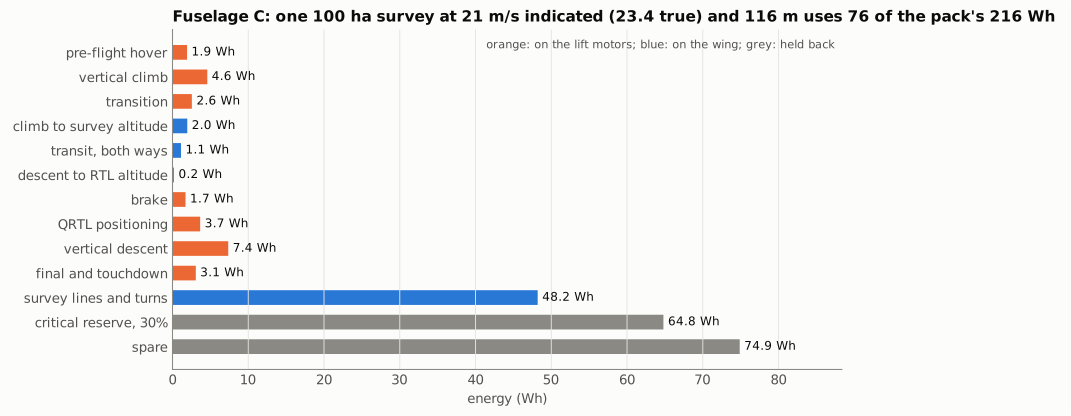
| Phase | Time | Energy |
|---|---|---|
| Pre-flight hover | 10 s | 1.9 Wh |
| Vertical climb to 50 m at 2.5 m/s | 20 s | 4.6 Wh |
| Transition, lift on until the wing carries the aircraft | 15 s | 2.6 Wh |
| Climb on the wing to 116 m | 22 s | 2.0 Wh |
| Transit, 300 m each way | 26 s | 1.1 Wh |
| Survey: 17 lines of 1 km and the turns between them, at the 35° roll limit and 25.0 m/s true in the turns | 17.2 min | 48.2 Wh |
| Descent to the RTL altitude, 80 m | 12 s | 0.2 Wh |
| Brake into the hover | 12 s | 1.7 Wh |
| QRTL positioning over the pad | 19 s | 3.7 Wh |
| Vertical descent from about 65 m to 3 m at 1.5 m/s | 41 s | 7.4 Wh |
| Final 3 m at 0.3 m/s and touchdown | 16 s | 3.1 Wh |
| Total | 20.4 min | 76.3 Wh |
The planning figure adds 4 % to the lines and turns, as the earlier page did, and comes to 78.3 Wh. At night, with the lights and their battery (3,198 g), the same survey is 80.0 Wh by the model and 82.0 Wh for planning.
The simulator agrees within about 3 %. th-testpilot’s S1, the same block flown on the C model c24b-w78 with the modelled airspeed sensor (2026-10-19, cref2), used 80.6 Wh at 3.034 kg. By phase: the takeoff and transition 8.2 Wh against this model’s 9.1, the time on the wing 54.4 Wh against 51.6, and the brake, QRTL and landing 15.9 Wh against 15.9. The wing share is the simulator’s drag, which sits about 3 % above the CFD polar at the same true speed (H1, 2026-10-19). The landing phase times that no parameter sets, the positioning and the height the QRTL starts its descent from, are taken from that flight, so the landing match is partly by construction; the powers are this model’s.
The vertical phases now cost about 25 Wh, a third of the survey, against 18 % on the earlier page. That is the profile, not the aircraft: the takeoff goes to 50 m, every forward transition holds the lift motors until the wing carries 20 m/s indicated, and the QRTL descends from about 65 m. The descent is the biggest single item after the lines.
Coverage per pack on Fuselage C
Section titled “Coverage per pack on Fuselage C”The largest square block whose survey lines end at the low-battery trigger, 45 % left, with the lines across the wind. “Model” is this page’s model; “planning” adds the same 4 % to the lines and turns. The return and landing come out of the low reserve (below).
| Build | Mass | Calm | 5 m/s crosswind | 8 m/s crosswind | 8 m/s, lines along the wind |
|---|---|---|---|---|---|
| Day, model | 3,025 g | 267 ha | 261 ha | 251 ha | 228 ha |
| Day, planning | 3,025 g | 255 ha | 249 ha | 240 ha | 218 ha |
| Night, planning | 3,198 g | 243 ha | 238 ha | 229 ha | 209 ha |
The across-the-wind rule from the earlier analysis holds: lines along an 8 m/s wind cost about 9 % of the block. The Survey3W case is not in this table, because it is not flyable on C as built: its trim weight exceeds the trim row (CG).
Survey speed, altitude and overlap on Fuselage C
Section titled “Survey speed, altitude and overlap on Fuselage C”The survey speed is set in the mission as an airspeed, and the flight controller holds what it reads. On C that reading is the side static ports at ARSPD_RATIO 2.3, which read low by an amount that depends on the angle of attack. In level flight 21 m/s indicated is about 23.4 m/s true, so the photos fall further apart than the 21 m/s the speed was chosen at would give.
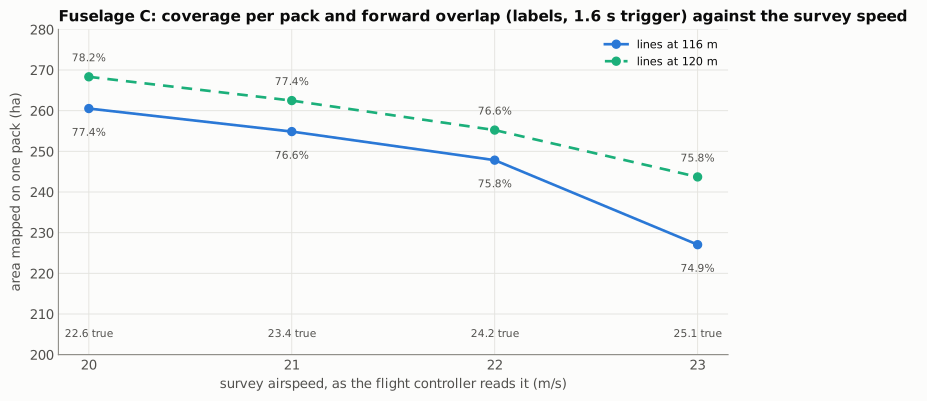
| Indicated | True | At 116 m: overlap, area | At 120 m: overlap, area |
|---|---|---|---|
| 20 m/s | 22.6 m/s | 77.4 %, 261 ha | 78.2 %, 268 ha |
| 21 m/s | 23.4 m/s | 76.6 %, 255 ha | 77.4 %, 262 ha |
| 22 m/s | 24.2 m/s | 75.8 %, 248 ha | 76.6 %, 255 ha |
| 23 m/s | 25.1 m/s | 74.9 %, 227 ha | 75.8 %, 244 ha |
Day build, planning areas, calm air, the 1.6 s trigger (with the camera’s 1.5 s, add about 1.5 points of overlap). At 116 m the resolution is 5.3 cm/px, at 120 m 5.5.
80 % forward overlap is out of reach on C. At 23.4 m/s true and a 1.6 s trigger, 80 % needs the lines at about 136 m, above the 120 m ceiling, and the slowest speed the aircraft is allowed to survey at, AIRSPEED_MIN 20 indicated, is still 22.6 m/s true. MAPIR asks for at least 70 % front-lap (capturing Survey3 images from a drone), so 75 to 78 % is inside its guidance, but it is less margin than the plan wanted. Slower and higher both help, and both also add area: 20 m/s indicated at 120 m gives 78.2 % and 268 ha. Those are the levers, not decisions: 21 m/s was chosen (Ryan, 2026-10-01) for the stall margin in gusts, in true airspeed; on C even 20 indicated flies faster than that true speed, but 20 is AIRSPEED_MIN itself, the floor TECS defends, so surveying at it leaves no margin above the floor; and 116 m keeps 4 m under the 120 m ceiling for height error. Ryan decides both.
Density altitude makes it worse, as on the earlier wing. At 21 m/s indicated and 116 m:
| Density altitude of the line | True airspeed | Calm photo spacing | Calm overlap |
|---|---|---|---|
| 0 m | 23.4 m/s | 37.5 m | 76.6 % |
| 500 m | 24.0 m/s | 38.4 m | 76.0 % |
| 1000 m | 24.6 m/s | 39.3 m | 75.4 % |
| 1500 m | 25.2 m/s | 40.3 m | 74.8 % |
| 2000 m | 25.8 m/s | 41.3 m | 74.2 % |
Read the real spacing from the first survey’s photo log, at the site’s density altitude.
The low-battery reserve on Fuselage C
Section titled “The low-battery reserve on Fuselage C”The low-battery trigger, 45 %, fires an RTL that has to bring the aircraft home from the survey’s farthest point and start its landing descent above the critical trigger, 30 %. On C the RTL flies home at AIRSPEED_CRUISE 22 indicated, about 24.2 m/s true, descends to 80 m, brakes and positions over the pad. The vertical descent and the touchdown, 10.4 Wh and 57 s, come out of the critical reserve.
| Far point | Headwind | Cruise home | To the start of the vertical descent |
|---|---|---|---|
| 100 ha block, 1543 m | 0 m/s | 64 s | 8.5 Wh, 427 mAh (4.3 %) |
| 100 ha block, 1543 m | 5 m/s | 80 s | 9.3 Wh, 464 mAh (4.6 %) |
| 100 ha block, 1543 m | 8 m/s | 95 s | 10.0 Wh, 498 mAh (5.0 %) |
| Largest planning block, 2206 m | 0 m/s | 91 s | 9.8 Wh, 489 mAh (4.9 %) |
| Largest planning block, 2206 m | 5 m/s | 115 s | 10.9 Wh, 542 mAh (5.4 %) |
| Largest planning block, 2206 m | 8 m/s | 136 s | 11.9 Wh, 590 mAh (5.9 %) |
The mAh use the same pack model as the earlier table (21.0 V open circuit, 45 mΩ).
The 45 % trigger stays on C. The return itself needs at most 5.9 % above the critical trigger in this model, where the earlier airframe’s planning figure was 11.4 %, but the trigger covers more than the return. After the return, the dock’s landing hold can keep the aircraft hovering for up to 2 minutes while a person clears the pad, before it diverts to its alternate point (clear to launch). At about 33 A in the hover that is about 5.5 % of the pack a minute. The hold ends at CTL_RESERVE_PCT 36 %, the critical 30 % plus the descent from the hold height (th-avionics e6252849), so with SITL’s return below, 45 % leaves about 65 s of hover from arrival over the pad: from 41.9 % until the reading first shows 35 %, below a true 36 %, at S5’s measured draw of 714 mAh in 76 s, about 34 A. About 45 s of that is the hold itself, after about 19 s of positioning (clear to launch gives the same, as estimates). At 40 % the hold would be gone. The trigger also counts against the pack’s nominal 10 Ah, so an aged or cold pack has less behind each percent than it shows (th-avionics, 2026-10-22). SITL agrees on the whole return. th-testpilot’s S5 on c24b-w78 (7fcfe781, six flights), from the 100 ha block’s corner with the return all upwind in 8 m/s, used 1,029 to 1,037 mAh, 10.3 %, from the low trigger to touchdown. This model gives 1,034 mAh for the same return: 498 mAh to the start of the vertical descent (the table above) and 536 for the descent and touchdown. The split differs. SITL’s cruise home took about 130 s against 95 s here, but not because it flies slower: the low trigger fired on a downwind survey line, about 80 m past the far corner, and the turn back added about 700 m of path, about 30 s (th-testpilot, three logs); a straight leg at its speed takes about 92 s. This model does not price that turn, about 0.7 % of the pack, but it books more than SITL for the brake, positioning and descent, which is why the totals match. A 40 % trigger would raise the day block to about 285 ha, 12 % more. th-avionics keeps 45 % in the common parameters; a 40 % survey-only setting, for flights with a pilot on site and no dock landing, is an option for Ryan once a C return is checked in SITL.
How the C numbers are made
Section titled “How the C numbers are made”Level flight comes from tools/c24b_level.py: the C CFD’s lift and pitch lines pinned to the fine run at alpha 6.7, a drag polar shaped by the CFD sweep and pinned to the fine pair at cruise lift, trimmed at the build’s mass and CG. The CFD re-baseline on the final geometry (W108, 2026-10-19) matched these inputs within about 1 %. The indicated speed becomes the true speed through the side ports’ measured Cp against alpha. Hover uses the EMAX ECO II 2807 on the F8041 3-blade (684 W at 3,025 g with 5 % download). Cruise power goes through the V3115 model on the APC 10x7E. Avionics take 8 W and the camera 1.7 W. The phases outside the lines follow the filed parameters (overhead_c in tools/mission.py), with the times no parameter sets taken from th-testpilot’s cref2 S1. Turns are 35° banked semicircles at AIRSPEED_STALL × √(load factor) indicated, converted to true at the turn’s angle of attack. The masses are the reconciled build-up in tools/cg_c24b.py.
The largest uncertainties are the same as before: the drag of the real airframe, the energy the pack really gives, and, on C, the airspeed sensor’s reading, which the first flights calibrate. Compare the first real survey’s energy, from the FC log, with the 76 Wh here for 100 ha.
The earlier wing (2026-09-26 to 2026-10-18)
Section titled “The earlier wing (2026-09-26 to 2026-10-18)”Everything below is the earlier wing at 2.85 kg on the ideal airspeed sensor, kept for its reasoning. Its numbers do not apply to the first build.
How much ground one pack maps with the Survey3, and where the energy goes. It joins the three other analyses: power from Propulsion, drag and trim from Wing Aerodynamics, and the camera limits from Survey3. Analysed 2026-09-26 for the chosen setup, again on 2026-09-27 at 2.25, 2.48 and 2.9 kg with the keel A landing gear in the drag and the CG at 270 mm, on 2026-10-01 for the 6S2P P50B pack (216 Wh) at 2.25, 2.75 and 2.9 kg, and on 2026-10-06 at 2.25, 2.85 and 2.9 kg, 2.85 being the first build as it flies (Ryan, 2026-10-06).
The short version: plan on about 292 ha per 6S2P P50B pack, the first-build pack since 2026-10-01, with the lines across the wind (table below, calibrated against SITL on 2026-10-01). By the model alone, one P50B pack maps about 305 ha at 2.85 kg, the first build as it flies (nose rev C and the CG slider, all-in keel B, the Survey3W and the Walksnail, no ballast; CG, 5856776), surveying at 20 m/s (about 366 ha at 2.25 kg; 318 ha at the 2.75 kg this page planned at until 2026-10-06). The cruise drag is the fine CFD’s since 2026-10-01 (aero); on the VSPAERO drag before it these were 265 and 277 ha. The block is sized so that the survey lines end at the low-battery trigger, 45% left. The return home comes out of that reserve, and the aircraft starts its landing above the critical trigger, 30% (the reserve). The Tattu 6S 4500 is now a tuning pack flown within 500 m of home, so it has no survey block. A 1 km² block, about the limit for visual line of sight, uses about 27% of the P50B pack. 20 m/s at 116 m is the survey speed (decided 2026-09-27 for the stall margin), and on the CFD drag it is also the speed that maps the most.
One survey, phase by phase
Section titled “One survey, phase by phase”The standard case is a 100 ha square block 300 m from the launch point, flown at 20 m/s and 116 m at 2.85 kg, the first build as it flies: about 2.84 kg on keel B and 2.87 kg on keel A with the Survey3W (CG, 5856776). Until 2026-10-06 this page planned at 2.75 kg, the P50B build with its nose ballast; the 2.85 kg tables are about 4 % smaller (Ryan, 2026-10-06). The mass is still an estimate until the aircraft is weighed.
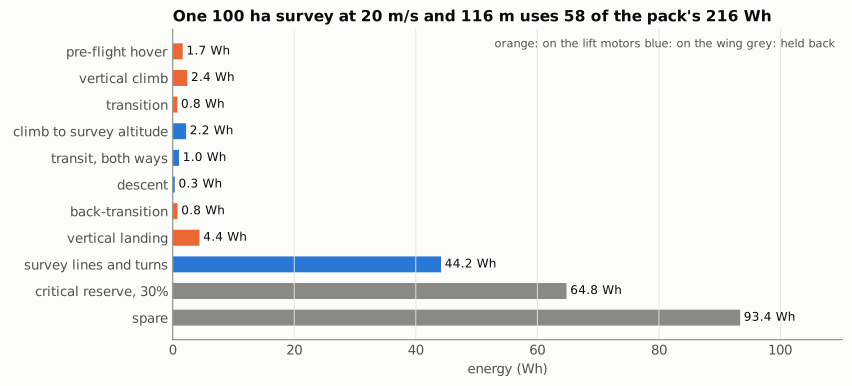
| Phase | Time | Energy |
|---|---|---|
| Pre-flight hover | 10 s | 1.7 Wh |
| Vertical climb to 30 m at 2.5 m/s | 12 s | 2.4 Wh |
| Transition | 5 s | 0.8 Wh |
| Climb on the wing to 116 m | 29 s | 2.2 Wh |
| Transit, 300 m each way | 30 s | 1.0 Wh |
| Survey: 17 lines of 1 km and the turns between them, at the 35° roll limit and 22 m/s or more | 20 min | 44.2 Wh |
| Descent to 30 m | 29 s | 0.3 Wh |
| Back-transition | 8 s | 0.8 Wh |
| Vertical landing | 28 s | 4.4 Wh |
| Total | 22 min | 58 Wh |
At 2.75 kg, until 2026-10-06, the survey lines took 42.8 Wh and the total was 56 Wh.
On the VSPAERO drag before 2026-10-01 the survey lines took 47.9 Wh and the total was 61 Wh.
At 2.59 kg on the Tattu pack the same survey came to 58.7 Wh.
The simulator agrees within 11%. th-testpilot’s calm 100 ha survey in SITL used 64.6 Wh against 58.7 Wh from this model at the 2.59 kg SITL then flew (2026-10-01, ending on RTL, the adopted landing): the lines and turns agree within about 4%, and most of the rest is the return and landing, 10.8 to 12.6 Wh in SITL on every survey (84 s, a hover at the landing point and the descent from 50 m) against about 5.5 Wh here. Until 2026-09-30 SITL read about 18% high, and most of that gap was a fault in the simulator, not in this model: its pusher windmilled at idle, braking about 10 N and drawing 10 to 15 A of fictitious current in every throttle-closed turn and descent. With the folding prop modelled as folded, level power did not change by a watt, which confirms the drag and pusher model behind this table. These comparisons are on the VSPAERO drag, which SITL also flew; on the CFD drag this model’s survey reads about 12% lower, and SITL re-flies on the CFD drag next.
Line order: adjacent lines are fine (revised 2026-10-01). At 20 m/s and 30° of bank the aircraft turns on a 71 m radius, so it cannot turn straight into the next line 64 m away: it swings wide in a teardrop. On 2026-09-28 the simulator measured that at about 25 s a turn, and skip-line order (each turn spanning three lines, a plain semicircle) took the survey from 10% over this budget to 4.5%. That was before the simulator’s pusher and drag were corrected. Re-flown on 2026-10-01 at 21 m/s on the CFD drag (th-testpilot, ten S2 flights), skip-line spans of 192 and 256 m cost 2 to 4 Wh more per 100 ha than adjacent lines, and did not lower the turn bank: ArduPilot’s L1 navigation captures the next line at the roll limit whatever the turn’s width. The adjacent-line surveys came in 2 to 6% under this page’s planning figure, so the table’s turn model, which prices semicircles, is close enough for planning. The turns at the 35° roll limit are where the survey comes nearest the stall: 1.22 g raises the stall to 20.3 m/s, 3.6% under the 21 m/s line, and in a 5 m/s gust field the angle of attack peaked at 11 to 15° (median 11.6°). On the CFD that is the soft part of the stall, short of the wing-drop regime near 17° (aero). The fix is a lower bank in the turns, not the line order; th-avionics owns that choice.
The P50B pack holds 216 Wh at its nominal 21.6 V. This survey uses 58 Wh of it. The plan never draws below the critical trigger, 30% or 65 Wh, which is held for a vertical landing on a pack that sags under hover current. That leaves 93 Wh spare on a 100 ha survey.
The reserve is a voltage as well as an energy. A LiPo sags under load, and the landing hover is the highest current of the flight, so the reserve has to hold up there, not only in watt-hours. In th-testpilot’s re-flown SITL surveys (2026-10-01), on the simulator’s 4500 mAh pack model, the calm 100 ha survey ended its lines at 21.9 V at rest. That left only 0.1 to 0.4 V above BATT_LOW_VOLT with the landing still to come. The along-wind survey fired the low-battery failsafe during a 70 s landing hover into an 8 m/s wind, at 20.4 V under load. So on the 4500 mAh pack, treat 100 ha as the limit in calm air with the lines across the wind, and check the last landing’s voltage in the first real logs. The 6S2P Molicel P50B pack (battery), at about 10 Ah, carries the same survey with a real reserve. The sag is the simulator’s pack model, not a measured cell (estimate).
The vertical landing is the most expensive phase after the survey itself. ArduPilot descends at 0.5 m/s for the last 6 m (Q_LAND_SPEED and Q_LAND_FINAL_ALT), which is half a minute near full hover power. All the vertical phases together cost about 10 Wh, 18% of the flight. That is the price of taking off and landing without a runway.
Coverage per pack
Section titled “Coverage per pack”Block size per pack, for planning (2026-10-01; at 2.85 kg since 2026-10-06). The largest square block whose survey lines end at the low-battery trigger, 45% left, surveyed at 20 m/s and 116 m with the lines across the wind. The return and the landing then come out of the low reserve, which is what the RTL fired by the trigger would do anyway (th-avionics, 6e9c094). “Model” is this page’s planning model. “Planning” adds what th-testpilot’s SITL surveys spent beyond it on the lines and turns, 4% (calm 100 ha survey). Their 8 Wh more on the return and landing is in the low reserve (below). The model costs the first build at 2.85 kg: nose rev C, the CG slider that replaces the nose ballast, all-in keel B, the Survey3W and the Walksnail (CG envelope, 5856776: 2.84 kg on keel B, 2.87 kg on keel A). Until 2026-10-06 it was 2.75 kg, the P50B build at 268 mm with the earlier nose and about 85 g of nose ballast; those rows read 318, 308 and 292 ha by the model and 304, 294 and 279 ha for planning. The masses are th-main’s per-part slices and sourced items; the measured mass replaces them.
| Pack | Energy | All-up mass | Calm | 5 m/s crosswind | 8 m/s crosswind |
|---|---|---|---|---|---|
| 6S2P Molicel P50B, 10 Ah, model | 216 Wh | 2.85 kg | 305 ha | 295 ha | 280 ha |
| 6S2P Molicel P50B, 10 Ah, planning | 216 Wh | 2.85 kg | 292 ha | 282 ha | 268 ha |
| P50B planning at 21 m/s, the interim survey speed | 216 Wh | 2.85 kg | 288 ha | 280 ha | 267 ha |
| P50B planning at 20 m/s, lines ALONG the wind | 216 Wh | 2.85 kg | (as calm) | 268 ha | 236 ha |
| P50B planning at 21 m/s, lines ALONG the wind | 216 Wh | 2.85 kg | (as calm) | 267 ha | 238 ha |
Fly the lines across the wind. Lines along it cost more: half of them fly upwind at the airspeed less the wind, and every turn drifts downwind and has to be flown back before the next upwind line. At 8 m/s that is about 19 % more survey energy than calm, against about 6 % across the wind, so a block shrinks about 11 % (the ALONG rows). th-testpilot’s S3, the standard block flown along a steady 8 m/s at 2.80 kg (2026-10-06), used 74.0 to 75.0 Wh, about 1 % under this model’s along-wind planning figure at 2.75 kg and 11 to 12 % over the across-wind figure it had been held to; S1 (calm) and S2 (5 m/s across, gusts) came in about 2 % under theirs. So the model holds in both directions; the across-wind rule is what the planning figures assume.
Survey at 21 m/s until the flight stall test (Ryan, 2026-10-01, reported by th-avionics). In th-simulator’s five-seed S2 at 20 m/s one seed touched 12.1° angle of attack with no assist; at 21 m/s every seed stayed under 12°. The 21 m/s row keeps the 20 m/s camera geometry, 116 m, as th-simulator flew it, and costs about 1% of the block (3% at 2.75 kg). At sea level, 21 m/s puts the photos 33.6 m apart with the 1.6 s trigger, 79% forward overlap, just under the 80% the plan wants; higher sites lose more (table below). The Survey3’s own 1.5 s minimum gives 31.5 m and 80.3%, but CAM1_INTRVAL_MIN stays at 1.6 unless th-main confirms the Survey3 holds 1.5 s for a whole survey: a trigger faster than the camera skips a frame and leaves a hole, which is worse than 1% less overlap (th-avionics, fab8476). MAPIR gives the 1.5 s only as an average for JPG, depending on the microSD card, and publishes nothing on the rate over a long survey (Survey3 interval setting). Its planning guidance asks for at least 70% front-lap (capturing Survey3 images from a drone), so 78 to 79% is inside it. Shoot JPG only: RAW+JPG takes 2.75 s a photo, which at 21 m/s puts the photos 58 m apart, about 64% overlap, under MAPIR’s 70%. th-main recommends a bench test before the first survey: the camera in 0.5 s interval mode for 50 minutes on the real card, with the EXIF timestamps read back; if they hold 1.5 s or better, th-avionics can move to 1.5 (th-main, 1695579, adds a U3/V30 card to the mapping list). Flying higher does not help: with the 1.6 s trigger, 80% at 21 m/s needs 122 m, above the 120 m ceiling. The shortfall is a calm-air one. The lines run across the wind, so the aircraft crabs and its ground speed along the line falls: at sea level 79.6% in a 5 m/s crosswind, and 80% from 6.4 m/s. A slower line in calm air would give back the stall margin 21 m/s is for, so this page keeps 21 m/s and 79% in calm air. The 100 ha survey at 21 m/s comes to 58.5 Wh by the model and 68.2 Wh on the planning basis at 2.85 kg, against 57.9 and 67.7 at 20 m/s (57.0, 66.7, 55.9 and 65.7 at 2.75 kg). This model puts the 100 ha survey lines at 44.6 Wh at 21 m/s against 44.2 at 20. With AIRSPEED_STALL 20.0 the surveys at 21 m/s used 0.3 to 1.8 Wh more than at 19.2 (th-testpilot, a92cbf5), against 0.4 Wh in this model, and all passed the planning figure. The most was S3, along the wind, whose downwind turns fly at the 22.1 m/s floor; the rest of the gap is not yet explained, and the planning factor covers it. Every turn’s angle of attack stayed at 10.1° or below. th-testpilot’s surveys at 21 m/s on this geometry (2026-10-01, surveys21) each came within 0.5 Wh of their 20 m/s figures, and all passed: S1 62.0 Wh against the 66.0 planning figure, S3 along the wind 70.4. The same flights measured the photos 34.5 to 34.9 m apart on the lines, not 33.6. The trigger is not late (ArduPilot’s camera runs at 50 Hz, so at most 20 ms). The survey speed is an equivalent airspeed, and SITL’s lines fly about 700 m above sea level, where 21 m/s is 21.7 m/s true and over the ground in calm air: 21.7 × 1.6 = 34.8 m (th-avionics). So the overlap depends on the density altitude of the line, which a hot day raises:
| Density altitude of the line | True airspeed | Calm photo spacing | Calm overlap | 5 m/s crosswind | 80% from a crosswind of |
|---|---|---|---|---|---|
| 0 m | 21.0 m/s | 33.6 m | 79.0% | 79.6% | 6.4 m/s |
| 500 m | 21.5 m/s | 34.4 m | 78.5% | 79.1% | 7.9 m/s |
| 700 m | 21.7 m/s | 34.8 m | 78.3% | 78.9% | 8.5 m/s |
| 1000 m | 22.0 m/s | 35.3 m | 78.0% | 78.5% | 9.3 m/s |
| 1500 m | 22.6 m/s | 36.2 m | 77.4% | 78.0% | 10.5 m/s |
| 2000 m | 23.2 m/s | 37.1 m | 76.8% | 77.4% | 11.7 m/s |
At 21 m/s equivalent airspeed, 116 m above the ground, the 1.6 s trigger and the 160 m footprint (standard atmosphere). The energy for the lines hardly changes with altitude: at one equivalent airspeed the drag is the same, and the higher true airspeed covers the line sooner. Read the spacing from the first real survey’s photo log, at the site’s density altitude, before treating any of these as the camera’s.
Until 2026-10-01 the rule was to land with 20% and a minute of hover in hand. That gave 349, 338 and 320 ha on the P50B, and 108, 105 and 100 ha on the Tattu 6S 4500 at 2.59 kg. The Tattu now has its low and critical triggers at 50% and 30% and flies only within 500 m of home (params/pack-lipo-4500.parm), so it has no survey block.
With the lines along the wind the block shrinks much more: the 100 ha survey along an 8 m/s wind used 74.0 Wh (3216 mAh) even when it ended on RTL, 26% over this model’s 58.7 at the 2.59 kg SITL flew, and fired the low-battery failsafe in the final landing on the 4500 mAh pack. The camera overlap rules it out anyway (below). On the P50B the 100 ha block, about the visual line-of-sight limit, fits with a wide margin in any crosswind. These are estimates: the SITL calibration comes from one calm survey, and the first real logs replace it.
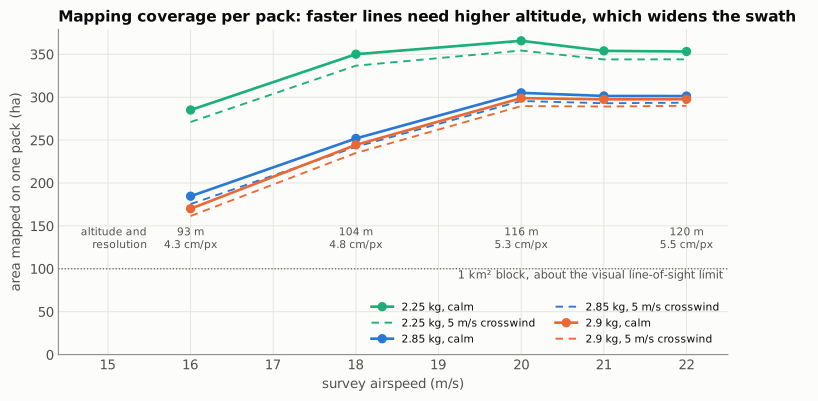
| Survey airspeed | Lowest altitude for 80% overlap | Ground resolution | 2.25 kg | 2.85 kg | 2.9 kg |
|---|---|---|---|---|---|
| 16 m/s | 93 m | 4.3 cm/px | 285 ha | (185 ha) | (170 ha) |
| 18 m/s | 104 m | 4.8 cm/px | 350 ha | 252 ha | 244 ha |
| 20 m/s | 116 m | 5.3 cm/px | 366 ha | 305 ha | 299 ha |
| 21 m/s, interim | 116 m (80% needs 122 m) | 5.3 cm/px | 354 ha | 301 ha | 297 ha |
| 22 m/s | 120 m | 5.5 cm/px | 353 ha | 301 ha | 297 ha |
All on one P50B pack (216 Wh), lines ending at the 45% low trigger, from the model alone; the planning figures above take about 4% off. At 2.85 and 2.9 kg the aircraft does not trim at 16 m/s on the CFD drag (17 m/s is the lowest), so the bracketed figures reuse the 17 m/s drag and read high.
The figures are for calm air. With a 5 m/s crosswind the aircraft crabs along each line and covers 3 to 5% less.
Fly the lines across the wind, never along it. The camera’s 1.6 s trigger interval sets a ground-speed limit for 80% forward overlap: at 116 m the photos can be no more than about 32 m apart along the line, so the ground speed can be no more than 32 / 1.6 = 20 m/s. At a 20 m/s airspeed that allows no tailwind at all. th-testpilot’s simulated surveys (2026-09-28) show both sides of it: with the lines across a gusty 5 m/s wind the survey passed every check at 63.1 Wh for 100 ha, 7% over the budget above; with the lines along a steady 8 m/s wind the downwind legs ran at about 28 m/s over the ground, the photos fell 49 m apart (about 70% overlap), the turns from downwind to upwind overshot by up to 333 m, and the survey used 74.0 Wh, leaving less than the 20% reserve (both re-flown 2026-10-01 ending on RTL; earlier figures of 65 and 82.5 Wh carried a simulator fault, below). So plan the lines crosswind, and if a site forces them along the wind, treat any wind over about 2 m/s as a no-fly for that plan. The landing also costs more in wind than the table allows. In the along-wind SITL survey the return and landing took 17.8 Wh when the mission ended on a VTOL_LAND item, and 12.6 Wh when it ended on RTL, against about 5.5 Wh in the calm table above. The rest of that survey’s overrun was the lines themselves, at 2.14 Wh per straight kilometre (th-testpilot, 2026-10-01).
The altitudes use the 1.6 s trigger interval that ArduPilot is set to (CAM1_INTRVAL_MIN), not the camera’s 1.5 s. So they are a few metres higher than the table in Survey3.
Coverage rises from 16 to 20 m/s at the build’s mass. The reason is the camera and the drag together. The camera shoots at most once every 1.6 s, so a faster aircraft must fly higher to keep 80% forward overlap, and the higher line has a wider swath. On the CFD drag the power hardly changes between 18 and 20 m/s (117 and 118 W at 2.85 kg), because the drag rises at the slow end near the pitch-stiffness dip, so the wider swath is nearly free. On the VSPAERO drag before 2026-10-01 coverage was flat from 16 to 20 m/s. At 22 m/s the altitude reaches the 120 m limit and cannot rise any more. The swath stops growing while the power keeps rising, so coverage falls.
The stall and the coverage now make the same choice. The trimmed stall is near 16.5 m/s (aero) and AIRSPEED_MIN is 18, so 16 and 18 m/s are below or on the minimum and stay in the table only to show what they would have given. The survey flies at 20 m/s and 116 m: 21% more area than 18 m/s at 2.85 kg, 5.3 cm/px, 4 m under the ceiling. Faster buys nothing: at 22 m/s the altitude is pinned at 120 m and the area falls 1%.
Weight matters as much as speed. Each 250 g costs about 25 to 30 ha a pack. The Survey3 and its mount are 88 g, which costs about 9 ha.
Settings that follow from this
Section titled “Settings that follow from this”| Setting | Value | Why |
|---|---|---|
| Survey speed in the mission | 20 m/s | 1.2 times the trimmed stall, and the most area the schedule allows |
| Survey altitude | 116 m at 20 m/s | Lowest altitude that keeps 80% forward overlap with a 1.6 s trigger |
BATT_CAPACITY |
10000 | The 6S2P P50B pack (4500 for the Tattu) |
BATT_CRT_MAH |
3000 | 30% left: land now. Set by the QLand voltage sag (Ryan, 2026-10-01). 1350 for the Tattu |
BATT_LOW_MAH |
4500 | 45% left: critical plus the return from the far point in an 8 m/s headwind, rounded up to 5% (below). 2250 for the Tattu, within 500 m of home |
th-avionics sets the values in the parameter files (6e9c094). Check them against the real pack, because its usable capacity drops with age and cold.
The low-battery reserve
Section titled “The low-battery reserve”The low-battery trigger fires an RTL. That RTL must bring the aircraft home from the survey’s farthest point, through the back-transition and a minute of hover over the pad, and start the QLand above the critical trigger. Critical is 30%: a 39 s QLand from 30 m holds 3.0 V a cell under load only from there in an 8 m/s wind (th-simulator 22343fb). So the low trigger is critical plus the return in an 8 m/s headwind, rounded up to 5%: 45%.
| Far point | Headwind | Cruise home | To the start of the QLand | Planning |
|---|---|---|---|---|
| 100 ha block, 1543 m | 0 m/s | 70 s, 136 mAh | 13.6 Wh, 682 mAh (6.8%) | 1063 mAh (10.6%) |
| 100 ha block, 1543 m | 5 m/s | 91 s, 176 mAh | 14.4 Wh, 722 mAh (7.2%) | 1103 mAh (11.0%) |
| 100 ha block, 1543 m | 8 m/s | 110 s, 213 mAh | 15.2 Wh, 760 mAh (7.6%) | 1140 mAh (11.4%) |
| Largest planning block, 2330 m | 0 m/s | 106 s, 205 mAh | 15.0 Wh, 751 mAh (7.5%) | 1132 mAh (11.3%) |
| Largest planning block, 2330 m | 5 m/s | 137 s, 265 mAh | 16.2 Wh, 811 mAh (8.1%) | 1192 mAh (11.9%) |
| Largest planning block, 2330 m | 8 m/s | 166 s, 322 mAh | 17.4 Wh, 868 mAh (8.7%) | 1249 mAh (12.5%) |
The RTL flies home at 22 m/s (AIRSPEED_CRUISE). The far point is the corner of the block, with launch on its centreline 300 m from the near edge and the lines running one camera footprint past the edge. The back-transition and 60 s of hover follow. The hover is 506 mAh in every row at 2.85 kg (486 at 2.75), more than the cruise home even from 2.3 km into an 8 m/s wind, so the hover time matters more than the distance. “Planning” adds th-testpilot’s 8 Wh SITL excess on the return and landing. The mAh come from the current at 21.0 V open circuit, 3.5 V a cell, with the pack’s 45 mΩ (an estimate for 30 to 50% charge).
th-testpilot’s S5 flight measured the return in SITL (2026-10-01, cbcf685, the table pusher on the VSPAERO drag) from the trigger to touchdown, so its figures also contain the QLand that this table leaves to the critical reserve: 972 mAh from the 1543 m corner into 8 m/s, 827 into 5 m/s and 731 in calm air, 1100 mAh from the 2240 m corner of the 265 ha block, and 1166 mAh from the 2509 m corner of the old 349 ha block. Each one from the 1543 m corner is below the planning column even with the landing in it, and on the first flight of S5 each landed 447 to 748 mAh above the critical trigger. So the planning figure that set the low trigger is conservative.
The return needs TRIM_THROTTLE 58. (On the earlier airframe. On C, TRIM_THROTTLE is 65 since 2026-10-20: 64.6 % holds 22 m/s indicated level on a fresh pack; th-simulator eaf7758e, th-avionics 822d1202.) Re-flown on the CFD drag (fadf08c), the 8 m/s return from the 1543 m corner took 879 mAh with th-avionics’ TRIM_THROTTLE 58 (9daced2): 255 mAh for the cruise home and 614 for the hover and landing, landing with 621 mAh left inside the 1500 mAh gap to the critical trigger. With the trim unset (45%) the same flight failed. The RTL turn at the trigger slowed into Q_ASSIST_SPEED three times, the lift motors carried the cruise home for 1047 mAh, and the return took 1685 mAh and touched down below the critical trigger. The turn is at 18 m/s and below, where SITL under-reads the CFD drag (6.6% at 18 m/s), so the real aircraft slows there sooner than the simulator does. Treat 58 as the floor, and check the airspeed through the RTL turn in the first real logs. The term this model gets wrong is the back-transition into a headwind: SITL spent 101 to 125 mAh in 10 to 12 s on the lift motors in 5 and 8 m/s, about 37 A and more than the hover, against 35 mAh here. In calm air it took 14 mAh. The cruise home took 302 mAh in SITL into 8 m/s, against 252 here on the same VSPAERO drag and 209 on the CFD drag.
At 31% the pack gives about 20.1 V under the pusher. In the first S5 flights the simulated aircraft could not hold height at 23 to 27 m/s on full throttle at that voltage. This model’s pusher, the APC 10x7E standing in for the folding CAM 10x7 (an estimate), gives 11.9 N at full throttle at 20.1 V and 22 m/s, and 9.3 N at 27 m/s, against 3.7 and 4.6 N of CFD drag. SITL’s old momentum pusher gave 8.8 N and 3.9 N. SITL now reads its pusher from this model’s table (th-simulator 2fae5b0, 88645df) and holds 27 m/s level at 31% on 91% throttle. A thrust test on the real prop is still the authority.
The cruise drag under these figures is the fine CFD’s since 2026-10-01 (Ryan). The VSPAERO drag before it read about 13% high at 20 m/s and 25% high at 30 m/s, because its elevon runs with the trailing edge up stop being physical past −7.5° and the trim fit ran through them. The low trigger does not change: the planning return into 8 m/s is 11.4% at 2.85 kg on the CFD drag and the EMAX lift motors (11.1% at 2.75 kg, 11.4% before), and 30% plus any of them rounds up to 45%.
How the numbers are made
Section titled “How the numbers are made”Hover power comes from the propulsion model: four EMAX ECO II 2807 1300KV lift motors on APC 8x4 props (EMAX’s published 58 mΩ since 2026-10-07; the XING2 2809 until 2026-10-04), with 5% download. Cruise power is the trimmed drag from the wing analysis (the whole-aircraft fine CFD since 2026-10-01), turned into electrical power through the V3115 and the APC 10x7E, which stands in for the folding 10x6 chosen later within about 6%. Avionics take 8 W and the camera 1.7 W for the whole flight. Turns are 35° banked semicircles between lines, at the roll limit where ArduPilot flies them, and at 20 m/s × √(load factor) or faster, the floor AIRSPEED_STALL 20.0 sets (22.1 m/s at 35°), with the extra induced drag of the bank (2026-10-01; 30° and the line speed before). The semicircle is a calibration, not the path: the aircraft flies a longer teardrop into the adjacent line, about 19.5 s banked a turn in SITL against 12.4 s here, but at lower power. On th-testpilot’s S1 split (2026-10-01) this model’s turns cost 9.1 Wh against about 9.9 in SITL, its lines 1.75 Wh/km against 1.70, and the survey 43.7 Wh against 43.5. Pricing the flown teardrop at this model’s turn power reads 9% high, so the semicircle stays. Each line runs one camera footprint past the block edge at both ends.
Limits
Section titled “Limits”This is a planning model, not a flight log. The largest uncertainties are the cruise drag and the energy the pack really gives. The drag comes from a model of the airframe. The pack’s energy depends on its age, its temperature and the current. Real surveys also lose time to wind gusts, a longer transit and extra hover while the GPS settles.
The first real survey is the check. Compare the energy used, from the FC log, with the 56 Wh here for 100 ha.
How it was done
Section titled “How it was done”PYTHONPATH=tools uv run --with numpy --with scipy --with matplotlib python tools/mission.pytools/mission.py uses tools/propulsion.py, tools/aero_report.py (the earlier wing) and tools/c24b_level.py (Fuselage C). It writes aero/mission/results.json: the earlier wing’s tables, c24b_21 (the frozen C reference the SITL battery’s energy gates read) and c24b (this page’s C figures, at the masses in aero/cg/c24b.json). The C figures in docs/mission/ come from figures_c, the earlier wing’s from figures.
From the kit’s makers, Nomadium Robotics, in their Pathfinder series:
- I Tried Building a Mapping Drone for Large-Scale Photogrammetry (40 min): the TerraHawk mapping with RTK and a survey camera
Source: docs/mission.md in the repo. Edit it there; this page is generated.
Comments
Comment on the whole page here, or on one section or step with the button beside it.